What is the Bland Altman method?
The Bland–Altman method is the recommended way to evaluate agreement between two dietary assessment methods—typically a new tool (e.g., an online recall, FFQ, image‑based method) and a reference such as a weighed food diary. It focuses on bias and limits of agreement rather than correlation, making it far more informative for judging whether two methods can be used interchangeably.
It quantifies how closely two methods measure the same underlying intake by examining:
- Mean bias — the average difference between methods
- Limits of Agreement (LoA) — the range within which most individual differences fall
- Patterns of disagreement — e.g., whether bias increases with intake level (proportional bias)
This is crucial in nutrition because true intake is unobservable, and both methods are imperfect. Bland–Altman therefore asks: Do the two methods agree well enough for practical use?
Useful papers
Measuring agreement in method comparison studies - J Martin Bland, Douglas G Altman, 1999
Statistics Notes: The use of transformation when comparing two means | The BMJ
Step-by-step guide
This guide shows the key steps for conducting a Bland Altman analysis, using Intake24 vs. reference method as an example.
- Calculate average nutrient intakes for both methods
In Excel or statistical software, calculate the average intakes for each method (Intake24 and reference), for the nutrients of interest.

- Calculate the ratios (=Intake24 [nutrient]/Reference [nutrient])
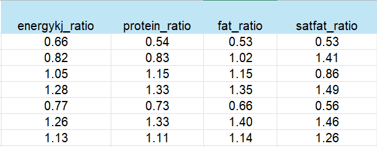
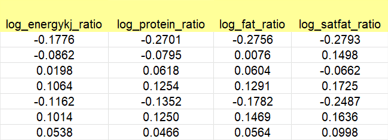
- Create histograms of the ratios to check the distribution of the data. If the data are not normally distributed, you will need to log-transform.
In Excel use formula: =LOG10[nutrient ratio]
In STATA use command: generate log_protein _ratio = log10( protein_ratio )
- Use statistical software to calculate descriptives for ratios. Output mean ratio and SD, and copy into Excel.
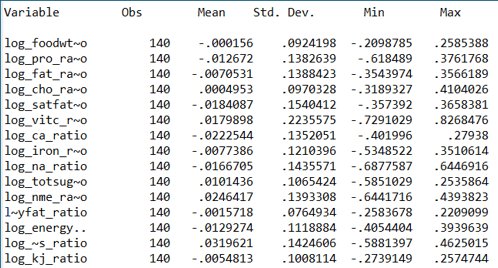
- Calculate the upper level (mean ratio+2SD) and lower level (mean ratio-2SD).

- Antilog the mean ratio, upper and lower level (=10^[value]) to give the geometric ratio. A value of 1 would indicate agreement, below 1=underestimate, above 1=overestimate. For example, for energy, a geometric ratio of 0.99 indicates an underestimation of 1%, and the limits of agreement range from -38% to 57%.
