Essential information Each food within Intake24 needs to be linked to a method or methods of portion size estimation. This can be:
● A food photograph – either an ‘as served’ or a ‘guide’ image ● A standard portion using household measures e.g. 1 teaspoon ● A standard portion using units of the food e.g. 1 small kiwi fruit or 1 snack size mars bar
Firstly, the images within the system should be searched to determine whether there is already a suitable photograph in the system for that food. If not, then a decision should be made about which is the most appropriate method of portion size estimation. Foods should be prioritised for photographing based on the frequency of consumption. Photographs should be taken following the process detailed in this section in order to ensure high quality images and consistency throughout the system.
Household measures, such as tablespoons or cups, can be added using average portion size information or by weighing. Standard portions e.g. for chocolate bars or biscuits can be added using market information on the sizes available, in this case the date and source of the information should be recorded.
Food photographs
There are more than 2500 photos of more than 180 foods in the UK Intake24 database. The foods to photograph were identified by looking at national data on the types and amounts of foods consumed and using frequency of consumption, contribution to energy intake and the amount consumed to prioritise foods for photographing.
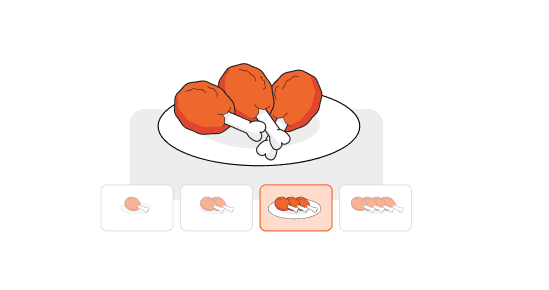
The food photographs are in two formats, a series of portions of increasing amounts for foods such as rice, pasta and broccoli, where the amount of food served varies (‘as served’ images) and ‘guide’ images for foods which come in pre-determined amounts such as biscuits, bags of crisps, bananas and slices of bread.
As served image
Guide image
Example of ‘as served’ and ‘guide’ Intake24 images
Deciding on use of photographs/ standard portions and or household measures
There are 3 different options for estimating the portion size of a food within the system; food photographs, household measures (such as teaspoons, tablespoons and cups) and standard portion sizes (such as medium sliced bread or thick sliced bread, Mars duo, Mars snack size, etc).
The most appropriate measure/s will depend on the food itself. Something like rice is best estimated from ‘as served’ food photographs as it can be served in any amount, an option to use tablespoons or cups may also be useful. Foods like apples and bananas which come in distinct units but in a range of sizes are best estimated using a ‘guide’ image displaying the range of sizes available, however, for less frequently consumed fruits it may be decided that it is not worth taking photographs of the food and standard portion sizes of small medium and large may be more appropriate. For foods which come in distinct sizes, such as chocolate bars, biscuits and crisps, standard portions may be most appropriate as these are easier to update when the pack sizes change.
Identifying existing images which could be used
Food photography is time consuming and costly so it is worth establishing whether an existing photograph is suitable. To do this, you can go through the spreadsheet of the foods in the Intake24 database that you used to develop the food list (where you have translated food names and identified where to delete/recode foods).
For foods already in the database
Go through the food list spreadsheet and use column O, the portion size estimation methods column, to identify the portion size method/s assigned to an existing food. For photographs the “serving image set” or “guide image id” can then be used to locate the photographs in the directory of food photographs, or in the Intake24 photographs folder.
For example below the food (baked beans) is linked to 3 portion size estimation methods, as served images of baked beans (serving image set “baked_beans”, a guide image of different sized cans of food (guide image id “AUSallcans”) and a standard portion of tablespoons.
If the portion size estimation method is suitable for use in the local population then leave the information in column O as is (you may wish to change the colour of the cell to indicate that portion size method selection is complete for this food).
Remember it doesn’t have to be the exact food, just similar enough to estimate the portion size.
In some cases, you could use a standard portion for example, this is used currently in the UK Intake24 for Glace cherries where we ask ‘how many glace cherries did you have’ and the user can choose the number of cherries.
Keep this in mind when deciding whether a new photograph is needed because it might be just as good to use a standard portion, especially if the food isn’t consumed that often. Also remember, one food can have more than one image or portion size estimation method linked to it.
Where a new method of portion size estimation is required indicate this by putting “new method needed” in the column. Details on deciding which foods to photograph, taking food photographs and assigning standard portion measures are given below.
New foods in the database
For the new local foods to be added to the food list first search within the directory of food photographs for a suitable image before taking any new portion size images. If the appearance of the food is similar to that in an existing food photograph, you can put the photograph code in column O e.g. UK beer bottles and cans may be suitable for different local beers in which case you can put “Gbeerbot” and “Galccans” in column O to indicate that these images can be used.
Where an existing photograph is used for a different food (e.g. cabbage for kale) a conversion factor will need to be calculated if the density of the two foods is different (See Calculation of conversion factors for equivalent foods below)
Again, if a new method of portion size estimation is required indicate this by putting “new method needed” in column O.
Prioritising which foods to take images of
Depending on the budget and the number of new images needed it may be necessary to prioritise which foods to take photos of. In this case, if consumption data is available for the target population then this can be used to prioritise foods based on the frequency of consumption of the item, the contribution to the total weight of intake and the contribution to total energy intake. Depending on the intended use of the system it may also be useful to look at percentage contribution to intake of other specific nutrients of interest.
Again, the hierarchy of sources for intake data starting with the most robust source should be followed:
National dietary data e.g. Government run national surveys. Ideally recent data collected using dietary recalls or food diaries. If possible data on the foods consumed should be used rather than the food code assigned to the item as it is acknowledged that food composition tables are not comprehensive enough to include all items consumed and that nutritionists will assign the closest match.
Large research datasets.
Food purchase data (although this will not allow determination of how the foods were prepared or cooked).
Local knowledge/ Dietician / Nutritionist.
Using pre-existing local food portion size images
For new Intake24 portion size images the following guidelines should be followed in terms of the format of the food photographs, the camera angle, number of portions to display and the increments in between each image. Where there are existing portion size images for a country it may be possible to use them even if the format is different. This should be discussed with the Intake24 team.
Rationale for the format of food photographs within Intake24
Number of images
For the majority of the ‘as served’ portion image series in Intake24 there are 7 different portion sizes displayed. Guidance on the development of food photographs written by Nelson and Haraldsdóttir (1999) recommends displaying an equal number of food portion size images within a food atlas in order to avoid the tendency for individuals to select the central image. This was on the recommendation of the perception psychologist on the steering group for the development of the adult food atlas (personal communication with Michael Nelson). The perception psychologists on the steering group for the development of the Young Person’s Food Atlas (Foster et al. 2010) both felt strongly that there should be an odd number of images in each series and that the mean portion (50th centile) should be displayed. This links with the decision to display the portion sizes in equal increments on a log scale (see next section). When 7 images are displayed on one A4 page they are of sufficient size and allow portion size to be estimated with a reasonable degree of precision (Nelson et al. 1996).
Increments
For the ‘as served’ images 7 portions are displayed in equal increments on a log scale. The decision to present the portion sizes on a log scale was made because of evidence from visual perception research which shows that sensory systems, including vision, respond in a logarithmic fashion to objects in the external world, a phenomenon known as Weber’s law (MacMillan and Creelman, 1991). The just noticeable difference (JND) is the minimum detectable difference between two stimuli. Weber’s Law asserts that as the magnitude of a stimulus increases, the JND gets bigger. This means that for example, the difference between 5g of baked beans and 30g of baked beans is much more noticeable than the difference between 211g and 236g despite there being 25g difference in each case.
5g
30g
221g
236g
Identifying weights of foods to present in the photographs
For new ‘as served’ photographs, where information on the range of portion sizes consumed by the population is available, the range should be 7 portions from the 5th to 95th centile of the weight consumed with equal increments on a log scale. A spreadsheet is provided that will automatically calculate the 7 portion sizes once the 5th and 95th centile are entered. If such data are not available the target population could be asked to serve themselves their usual amount of the food in order to generate the range of portion sizes or expert knowledge could be used to prepare a range of portion sizes from a very small to a very large portion. Where population data are to be used review the 5th and 95th portion sizes to make sure that they are realistic. It is possible that they may represent errors in recording or estimation of portion size.
For ‘guide’ photographs of foods which come in distinct amounts e.g. biscuits, chocolate bars, bread buns or cakes a range of commonly available sizes should be weighed and photographed. For none packaged food items where a guide photo is to be used such as for whole fruits or vegetables it is recommended that 20 to 30 units of each food are organised into size order and weighed (this can be done in the shop in order to avoid buying more items than required). The items to be displayed in the ‘guide’ image should be selected to show the range of sizes available with the difference in size between each item being perceivable and fairly equal (Vossenaar et al. 2020). Make sure both the visual increments and the weight increments seem sensible, due to the variable nature of fruits and vegetables size differences don’t always result in the expected weight differences.
Where items such as fruit and vegetables come with inedible parts e.g. stones, core or skin these should be included in the weight of the food associated with the food photograph. The food should then be linked with a food code for the item weighed with inedible parts. If only food codes for the edible portion exist a conversion factor will need to be applied to adjust the portion size. Column H in Sheet 1.2 ‘Factors’ of McCance and Widdowson's composition of foods integrated dataset contains the edible portion coefficient for many common food items. The value is the amount the weight of the whole food needs to be multiplied by in order to determine the edible portion, e.g. the edible portion coefficient for apple weighed with skin and core is 0.87 so 87% of the whole food is edible. Other food composition tables also include data on the edible portion for example the Australian composition tables give the % analysed portion which represents the edible part of the food. The USDA handbook on food yields is a further valuable source of data.
Taking food photographs
Studio set up
For the best quality photos use a professional photographer who will be able to supply appropriate lighting etc. You will need a white base and background for the images. A large roll of wide (1.3m or above) paper works well or a light tent.
Camera set up with flash and white boards
Camera set up with multiple flashes and a large white paper sheet
Light box
Camera set up with multiple flashes and a light box
Suggested equipment list
Digital SLR e.g. The Canon EOS RP with RF 24-105mm IS STM Lens or Nikon D5 with 24-70mm lens.
Tripod with large weight capacity and multi angle central column e.g. Vanguard VEO 3+ 303CT
Sand bags to fix the position of the tripod legs
Lighting kit e.g. The Pixapro Lumi 200 II Twin Head Softbox Kit
Light tent e.g. PixaPro 120cm Studio Shooting Cube Light Tent
Studio light reflector e.g. NEEWER Light reflector Panel for Photography, 39.4"x59"/100x150cm
White paper backdrop 1.5m (or wider if you have the space) arctic white paper e.g. Colorama 2.18x11m Arctic White Background Paper
Black paper backdrop 1.5m (or wider)
Background stand e.g. NEEWER Background Stand Support System 2.6M x 3M/8.5ft x 10ft
As a guide the Australian images were taken using a 24-70mm lens, at maximum resolution with as low as possible ISO setting and with an aperture setting of f9 or f10. The plate and cutlery won’t be fully sharp at f9 but make sure the food itself is sharp (where you have your focal point).
For the majority of foods the angle of the photograph should be around 42 degrees (this is the approximate viewing angle when sat at a table). The easiest way to do this is to use a tripod and set the camera at a 42-degree angle on the tripod. There are also apps which you can use on your phone such as Angle meter 360 for iphones or Angle meter for android which can be used to really fine tune the angle.
For certain foods it may be necessary to adjust the angle in order to adequately capture the depth of the food e.g for bananas the angle was adjusted to 62 degrees as this better captured the range in sizes.
62 degree angle
42 degree angle
For glasses and coffee cups where the sliding scale is to be applied, the images should be taken at an angle of zero. For guide images showing a range of drinks bottles and cans an angle of 10% was found to be best for displaying the different container sizes.
Note: It is best to get all photos to be taken at one angle completed and then change the set up.
Additional tips
Certain items do not show up clearly against a white background eg. clear glasses and white mugs. In this case a black background should be used. Glasses proved to be tricky against both a white backdrop and a black background and therefore white flags were used to highlight the edges of the glasses.
If available, use a camera which has a remote control to take the photo as this eliminates any camera movement, then the camera can remain in the same position and all you need to do is change the food being photographed. Once set up take a couple of photographs of the empty plate and crockery and compare with the Intake24 UK images to check that the images look similar.
Make sure there are no fingerprints on the glasses or cutlery or marks on the crockery or backdrop.
It is useful to have someone checking the food images as they are taken, ideally on a laptop screen so that if any need to be retaken they can be done before the food has been discarded. This can be done along with naming of the individual images.
Reflective surfaces such as crisp or sweet packets are captured better in the diffused light of the light box. Elevating packaged products with blu tack helps them to look less flat and gives them a bit more definition.
Post production
If you get the white balance right and have a seamless white backdrop there shouldn’t be too much editing just a global white balance across the images in post-production. It is much better to swap out the background if it becomes dirty rather than to try and tidy it up in post-production. Where a guide image includes a large range of packaged items and the products go beyond the edge of the seamless backdrop it may be necessary to create more backdrop in post-production. This can be reduced by using wider paper.
There will always be some shadows. Use a reflector/difusser to tweak every shot to reflect light back in and ensure there is definition on each item.
Preparing the foods
The standard format for the Intake24 food images is on a plain white 23cm (9 inch) dinner plate or a plain white 18.3cm (7.2 inch) bowl. Present foods on the left side of the plate where possible and include a knife and fork (or culturally appropriate alternative) in all food photographs as a reference to help people to judge the scale. This includes ‘guide’ photos.
Recommended placement of food on the left side of the plate and inclusion of a knife and fork
Foods should be weighed using calibrated digital scales with 1g display increments and a precision of 1% across the load range (Vossenaar et al. 2020). Remember to zero the scales with the plate or bowl in place so that the weight of the crockery is not included in the weight. For packaged food items record the weight given on the pack. Do not put the food on the scales in the packet and include the packet in the recorded weight (this has been done!). It is useful to have several people to help with weighing out of foods, placement of the foods in front of the camera and keeping the workplace relatively clear.
Some foods can be weighed out in advance, for example breakfast cereal portions could be put into food bags or containers, others will need to be weighed out just before being photographed as the look of the food will deteriorate with time. For example, tomato ketchup if left for too long will start to separate and risotto will congeal.
When weighing out the foods according to the portion size calculations for the ‘as served’ foods some items will enable more precise measurement that others. For example, it will be easier to produce the exact weight with a food like rice or mashed potato than for foods which come in larger pieces such as boiled potatoes or chips. In this case it is acceptable to have the weight of food 1-2g either side of the calculated weight, but make sure you record the actual weight of the food in the photograph. Use common sense when weighing out the calculated portions, as these are the 5th to 95th centile it is possible that some of the portion sizes are not practical to display in an image for portion size estimation.
1g vegemite
For example, in the UK version of Intake24 there are only 5 images for estimation of the amount of certain cereals (as opposed to the standard 7). This is because the 2 largest portions would not fit in even a large cereal bowl and are likely to reflect people consuming more than one bowl for a single meal. Likewise, in the Australian version the smallest portion of vegemite would not spread across a slice of bread, it could be that this was used as an ingredient in a prepared dish.
For cooked items the method and degree of cooking may alter the weight of the food but not the size, for example, well done oven chips will be lighter than the same chips cooked according to the instructions. For this reason, it is best to go for a “medium” degree of cooking for such items.
Foods may either be plated up ready to photograph or, if crockery or space is limited, weighed out into containers, food bags or onto greaseproof paper.
Preparing portions on a plate
Space saving by preparing foods onto greaseproof paper
Once you have the plate in position in front of the camera, place a faint marker on the base of the light box or surface so you know where to position the plate each time. This stops the plate from jumping around the screen when moving between portion images in the system and helps to speed up the process of taking the photos. Gaffer tape or Blu tak can be used to create a visual and tactile marker to help with correct placement of the plate. Post-it notes detailing the weight of food on the plate can be useful in making sure there is no confusion between similar portion sizes of the same food. Taking a photograph with and without the post-it note in place is a useful way of guarding against loss of the weight data associated with the food photograph.
Marker to guide positioning of the plate
Post-it notes with the weight of the food
For some foods it will be possible to add increments to the first portion meaning the plate or bowl can remain in place. This works well for dry foods like breakfast cereals or nuts. So, for example, if the first portion of cereal was 15g and the second was 19g you would just add 4g to the bowl before taking the second photo. This does not work well for amorphous foods such as tomato ketchup or mashed potato which are dolloped onto the plate.
Some foods crumble and can be challenging to cut to size. Buy extra of these foods to allow for some wastage. For ‘guide’ images where you may want to show one eighth, a quarter and half of an item, such as a loaf of bread, a tape measure can be useful.
Some foods will require cooking in order to look right in the photos whereas others will be fine served cold. For example, for nachos simply melting the cheese for the photograph removes the need to cook the whole dish. Where foods have been cooked they will need to have cooled enough prior to photographing that they do not steam up the camera lens.
For Guide images make sure that items are well spaced so there is no overlap. The outlines of each item in the guide photographs will be identified in order that items within the image can be selected by clicking on them. If there is overlap between items within the image then the correct item may not be selected.
Guide image with item outlines
It is important to also think about the groupings presented in each photograph. Initial portion size images focused on groupings by target audience e.g. there was a photograph which contained all of the mini chocolate bars in one photograph. Having the same product in different sizes e.g. all sizes of mars bars together works better in the context of an online recall. It is also best to avoid a mixture of full packets with individual items in one image e.g. packet of starburst and an individual starburst sweet as this can confuse users when it comes to the “how many did you have” question.
Naming of food photographs
The name of the food images will not be visible to users of Intake24 and therefore it is useful to name the saved digital image with the food name and weight. For long food names this can be abbreviated e.g Strawb21g. This also makes checking of food codes against the associated weights much easier.
Uploading images and portion sizes to system
Images should be stored in a parent folder given the name of the locale e.g. England and then stored in subfolders by food, e.g.
These should be provided to the Intake24 development team along with a spreadsheet detailing the filepath, food names, image code (name of the individual image file) and the weight of the food (for as served images). For guide images the weight column should be left blank as the weights will be allocated using the editor tool once the image has been uploaded and each individual item within the image has been outlined.
For the filepath the parent folder (e.g United Kingdom) should be replaced with “.” e.g.
Filepath
Food name
Image code
weight
.\Cheese\Cheese grated
Grated cheese
Cheg1
10
.\Cheese\Cheese grated
Grated cheese
Cheg2
15
Calculation of conversion factors for equivalent foods
Where images are used for a similar food a conversion factor will be needed to account for the difference in density between the two foods. The equivalent food should be similar in terms of the shape, colour and consistency as the food shown in the images and should be eaten in similar amounts (Vossenaar et al. 2020). The FAO food density database contains data on the g/ml values for a wide range of foods and drinks. Further density data can be calculated from the AUSNUT Food Measures Databaseusing the weight in grams and volume in mls columns.
If no published data on density exists for either the equivalent food or the food in the food portion size image then the foods should be prepared and weighed. The density of the foods can be calculated by using a large container of known volume such as a 2-litre measuring jug. If a food is expensive and infrequently consumed then a smaller container could be used.
For pourable items such as drinks, custard and porridge place the jug on calibrated scales and zero, fill the jug to the 2-litre mark with the liquid and record the weight. The weight of the food divided by 2000 (ml) will give you the density of the food or drink.
First place the container on the calibrated food scales and zero the scales. Then fill the jug to the marked level, e.g. 2 litres, with small seeds such as mustard seeds and record the weight of those seeds. The weight of the seeds divided by the volume will give you the density of the seeds e.g. if the weight of seeds is 1400 then the density of the seeds will be 0.7 (1400 / 2000ml = 0.7). To determine the density of an individual food, weigh a portion of the food and place it inside the container, zero the scales and pour in the seeds until the container is filled to the marked level and record the weight of the seeds. The weight of the seeds / the density of the seeds will give you the volume of the seeds. The volume of the food will be the volume of the container minus the volume of the seeds.
So, for example if you put 500g of rice into the jug and the weight of seeds needed to fill the jug to the 2-litre mark is 973g:
Weight of seeds/ density of seeds = volume of seeds = 973 / 0.7 = 1390ml
Total volume of the jug minus volume of seeds = volume of test food = 2000-1390 = 610ml
Density of the test food = food weight / food volume = 500/610 = 0.82
To calculate the weight of an equivalent food from the weight of the original food in the food photograph you will need the density for both foods. The weight displayed in the photo will need to be multiplied by the ratio of the equivalent food to the original food.
Conversion factor = Density of equivalent food/ Density of food in portion image
For example, if an image of peanuts is used for pistachio nuts and the density of pistachio nuts is 0.65 while the density of peanuts is 0.53 then the weight displayed in the food photograph would need to be multiplied by a factor of 1.23 (0.65/0.53) in order to calculate the portion weight in grams.
Validation of new images
Where possible all new images should be validated, ideally in a representative sample of the intended users. This can be done in a number of ways and the most appropriate way will depend on the number of food photograph series which need to be tested. If only a small number of additional food photographs are to be added then these could be tested in a feeding study where participants come to a cafeteria style setting. The portion sizes can either be served in pre-determined amounts or the individuals may be allowed to self-serve from containers placed on scales with researchers covertly noting the difference in weight as the food is served. If pre-determined amounts are used these should represent a range of small, medium and large portion sizes as the accuracy of estimates may vary across the range of food weights. Any plate waste should be collected and recorded in order to determine the amount consumed for each food by each individual. The crockery used in a feeding study should not be exactly the same as that used in the food photographs as this is unlikely to be the case when the images are used in a real-life survey and will give an overly positive picture of the accuracy of estimates. If a large number of food photograph series are to be added then it may be more practical to conduct a ‘food in front’ study where the portions of food are presented on a plate for the participants to look at rather than consume. Participants could estimate the amount of food using the food photographs with the food still in view (testing only the participants perception of the food portion size) or, in order to test the images under circumstances similar to a dietary recall they could view the food portions and then estimate the amount of food after several hours or the following day (testing perception, conceptualisation and memory of the portion sizes). Again, the number of foods will need to be considered as participants can not be expected to remember the portion sizes of a large range of food items so where this is the case the food in front option may be the most practical.
The accuracy and precision of estimates made using the food photographs can be assessed by calculating the ratio of the weight estimated using the food photograph to the actual weight measured using the food scales. This allows data from foods for which the usual portion sizes differ widely, such as butter and mashed potato, to be compared in a meaningful way. If there is exact agreement between the estimated weight and the actual weight the ratio will be 1. A value of less than 1 indicates an under-estimate of portion size using the food portion photographs. The mean ratio of all estimates for a particular food will give the accuracy of estimates at the population level. In order to assess the precision of the estimates the 95% limits of agreement should be calculated as the mean ratio plus and minus 1.96 times the standard deviation. It is also useful to calculate the percentage of estimates which lie within 10% of the actual weight of the food.
Standard portion weights
Option to select ‘standard portion sizes’
Where standard portion sizes are used, the weights associated with these need to be provided. Standard portions can be household measures e.g. teaspoons, tablespoons, cups etc. or common units such as slices of bread or number of cherries.
For household measures the weight of food associated with each utensil may be calculated from the density information and the volume of the utensil using the FAO food density database or the AUSNUT Food Measures Database along with utensil volume in mls columns. Alternatively, density data can be found online or by measuring out and weighing the food portion. If weighing the food portion, it is recommended that each measure is replicated 10 times and the average used.
Standard portions can also be in terms of units of the food e.g. small, medium or large kiwi fruit. As recommended for the guide photographs 20 to 30 units of each food should be selected representing a large range of the sizes available. These should then be sorted into size order and weighed. The mean of all of the samples should be used as the medium portion. The mean of the 2 smallest and largest portions should be used for the small and large portion sizes respectively. Where items such as fruit and vegetables come with inedible parts e.g. stones, core or skin the food should then be linked with a food code for the item weighed with inedible parts. If only food codes for the edible portion exist a conversion factor will need to be applied to adjust the portion size as described Above.
Standard portions may also be used for branded items instead of guide photographs. This may be particularly useful for packaged items such as biscuits and crisps where the pack size changes quite regularly. For example, Fun size, Snack size, Standard and Duo may be used for chocolate bars. This information can often be readily found on supermarket websites. The date and source of this information should be recorded.
Nelson, M., & Haraldsdóttir, J. (1998). Food photographs: Practical guidelines II. Development and use of photographic atlases for assessing food portion size. Public Health Nutrition,1(4), 231-237. doi:10.1079/PHN19980039
Nelson M, Atkinson M, Darbyshire S. Food photographs improve estimates of nutrient intake in dietary surveys. Proc. Nutr. SOC. 1996; 56: 205A.
Vossenaar, M., Crispim, S. P., Lubowa, A., Deitchler, M., Moursi, M., & Arimond, M. (2020). Guidance for the Development of Food Photographs for Portion Size Estimation in Quantitative 24-Hour Dietary Recall Surveys in Low-and Middle-Income Countries.
Vossenaar, M., Hotz, C., Lubowa, A., Ferguson, E., & Deitchler, M. (2020). Recommended Specifications for Dietary Scales for Use in Quantitative 24-Hour Dietary Recall Surveys in Low-and Middle-Income Countries. Washington, DC: Intake–Center for Dietary Assessment/FHI Solutions.